Communicating team performance to your boss
Measuring the performance of a development team is notoriously difficult. People have tried using lines of code, function points and other more complex measures. Some still rely on tracking the hours developers spend in the office as the key measure of value produced :). Even when you trust everyone is working their best it is still a struggle to see if a team is more or less productive one month to the next, because they never produce the same thing twice. Yet we'd still like to know, and so would those we report to.
Today we will look at two pieces of data and how to explain those to your boss so they can see the improving (or consistently high) performance your team is achieving.
Using cycle time to explain improvements to your boss
Take a look at these figures from the previous post about removing bottlenecks in our process.
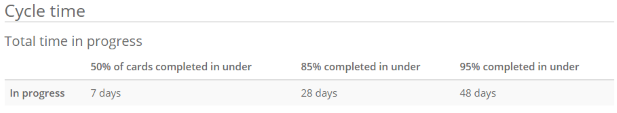 The total time in progress here shows that if your boss asks how long a random card will take you can tell them with 50% certainty that it will be done in a week. Maybe they want to be more certain than a coin toss that you will deliver on time? In that case you will need to estimate 1 ½ months to get to 95% certainty!
Now imagine in 6 months time if after a lot of work and improvement our numbers look like this
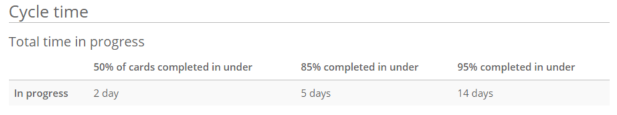 Now we can tell our boss that if they pick a random card and ask how long it will take to complete you can be 95% certain it will be completed in 2 weeks or less. On top of that, half of the cards worked on get completed in under 2 days.
Now your boss may think they can get work done this fast already, the point here is that these times are delivered by the team without any disruption to their process. It is possible now that boss requests are expedited at the cost of other tasks. No one really wants that.
Explaining things like this is something people outside of development teams can often appreciate. Knowing they can ask for something to be done and have a high level of certainty it can be delivered 2 weeks later without it disrupting the teams work is good to know. I am sure your boss would agree that going from nearly 7 weeks to deliver something to 2 weeks would make a huge difference to the businesses ability to deliver work on time and react to changes. That might be a good time to bring up your team’s next bonus :)
Obviously there could questions around relative card size or complexity. While it could be that the team is working on smaller tasks (no bad thing in itself) there is a limit to how far those improvements can go. This is where the CFD comes in, to help show how we got these improvements.
Using the CFD to show your process improvements
Let’s look at two CFDs. This first one which suggests a few things we should look to improve in our process.
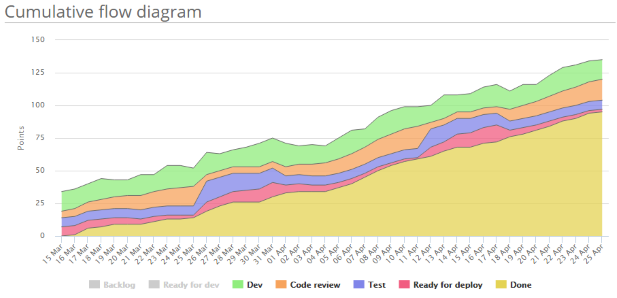 What we can see here are frequent buildups of work in various parts of our process. A few questions spring to mind here, e.g. does code review always need to take so long? The same could be asked of the ‘Ready for deploy’ list.
Now if we take that as the before picture you can show your boss, here is the after picture some months down the line.
 Here we have done three things:
1. Reduced the number of cards in the code review and ready for deploy lists.
This is probably one of the most impactful changes in this CFD. If you tell people that you now get work done 3x as fast as before they may not believe it. Yet if you show them that time spent on these cards previously was mostly spent waiting in these lists, and that you have reduced that time down they can see how it was achieved. By getting cards out of those lists faster you have sped up the whole process end to end.
2. Dramatically reduced the scale of the buildups of work in all of the lists
Reducing the scale of buildups should be understood as a good thing since it means people are not getting overloaded with too much work as those lumps work their way through the system. This has an impact both on quality and the ability for cards to get quickly through the process.
3. Reduced the amount of work in progress in total
Finally, by reducing the total amount of work in progress you let the team focus on delivering a smaller amount of work all at once. Rather than context switching and trying to focus on too many things at the same time. This again allows them to get cards completed faster.
To summarise, showing improved performance with Corrello comes down to
- Showing that the average time from starting work on a card to completing it has been reduced. And that you can now say with 95% certainty for some randomly selected card that it will be done in X days.
- Showing how those changes came about with the change in the CFD chart.
It’s still a little technical, but it’s backed up with actual data about your team. Hopefully it gets the message across that these improvements are real. And, once you have the performance you want it is still useful to be able to show these numbers and charts as evidence things continue to work well.
If you've read this far and you've not got a Corrello account you should try out our 14 day FREE trial.